This article describes the possibilities of working with orders within the TV chart.
You can change the color and quantity of displayed trades. To edit the color or quantity of displayed trades, go to Settings > Interface > Chart Settings.

In addition to the number of trades, there is also a time limit:
Trades on the chart also have a time limit. Regardless of their number, they will be removed from the chart after 6 months.
Stop loss from the strategy includes orders from the main stop loss, stop loss at breakeven level and SL+.
2. "Create alarm" button
Full details on the features and ways to use alarms are provided in the article "Alarms" block.

5. Quick access menu for favorite instruments
For user convenience, there's an option to pin the quick access menu for favorite trading strategies on the top panel of the chart block. To do this, go to the "Settings" -> "Interface" -> "Chart settings" section, and use the checkboxes to mark the ones you need.

5а. Button to open the mobile order creation window
This option is available for BASE, PLUS licenses and above.
It is a full equivalent of the Buy/Sell block, but presented as a pop-up window within the chart. An indispensable feature when trading in full-screen mode or on a mobile device.
The option may not be displayed by default. To enable or disable this button, follow the instructions shown in the GIF.

By default, after making changes to the TV chart, the chart is automatically saved in the browser's local storage, within the current template. Users can disable the auto-saving function in the platform settings, under the "Interface" section:

Example: On the left changes have been made to the chart, on the right the chart is saved with no changes:

If you disable the auto-saving feature for the chart, a "Save" label appears under the template name whenever you make changes to the chart. To save the changes in the template, you need to click on the template name.
Automatically saved templates are only accessible on the current device and browser. To access the chart template from a different browser or device, it's necessary to save the template(s) to the server. Open the context menu, right-click anywhere on the chart or click the "Gear" icon below the price column, then choose "Save chart to server" from the menu.

In case of success, a notification about the template chart saving on the server appears in the upper right corner of the terminal:

Templates saved on the server have a cloud icon in the list:

It's also possible to save the chart under a different template. To do this, select the "Make a copy..." option and rename the template in the future.
Or you can create a completely blank template without a single picture (this may be necessary to improve the performance of the TV-chart). You can create a new template from the chart field: click on the chart and select the "Create a new empty chart" option.
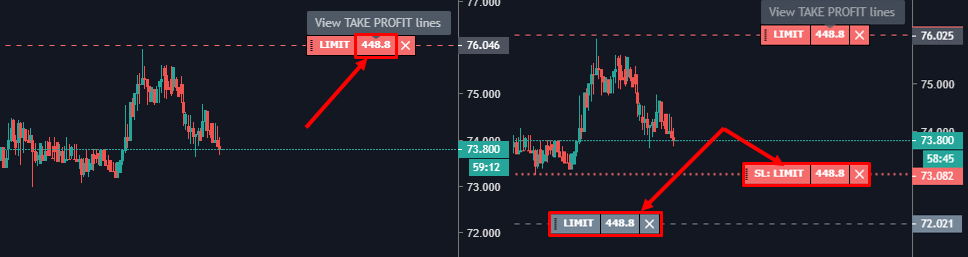
When working with the same chart template in multiple browser tabs, any changes made in one tab immediately reflected in the other tabs. To work with different trading symbols in separate browser tabs, use different templates for each tab. Otherwise, there's a risk of losing the changes made to the chart.- move or cancel orders of any strategy;
- adjust orders of the Fibo strategy to the levels in real-time;
- change the buy/sell level (higher or lower);
- move buy order of Squeeze strategy;
- When a sell limit order on the chart is lower than the level of the current price, a sell market order occurs. Applications are collected in an order book until one of the events:
- Order book contains all orders to the price level to which the order is moved;
- moved order is executed by 100%.
9. Quick access to LEXX terminal settings
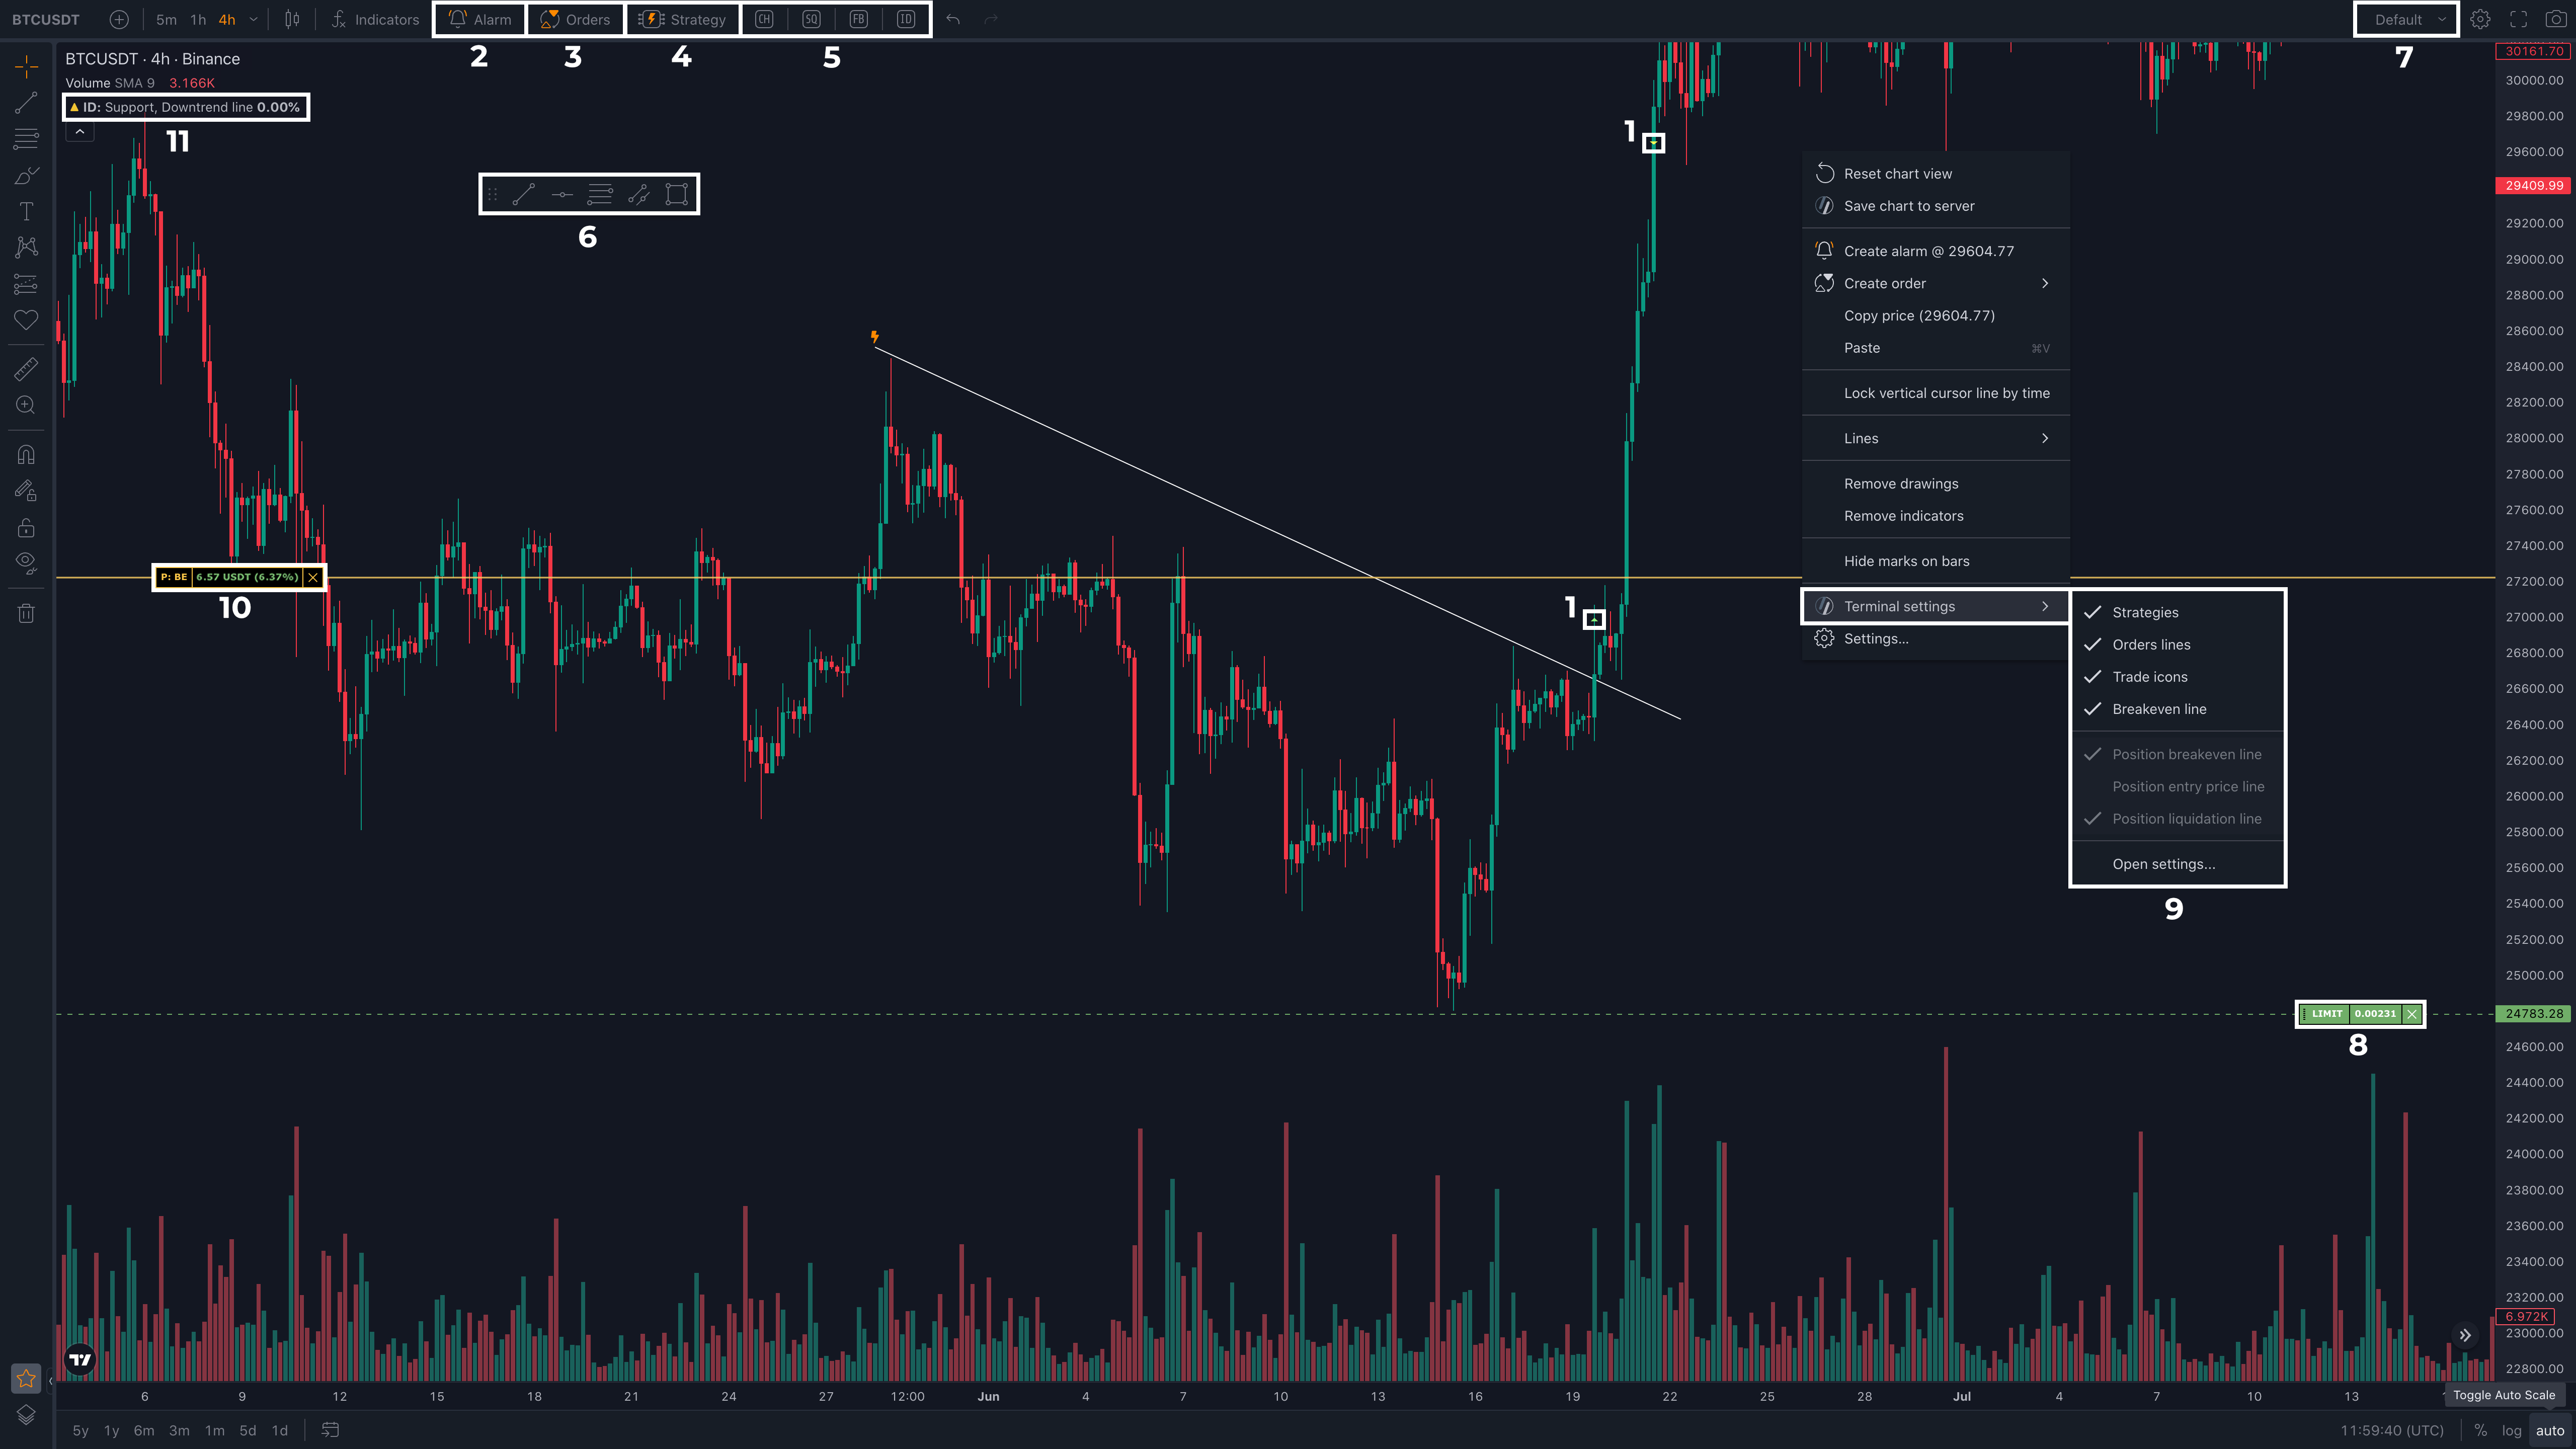
The "Terminal settings" option in the context menu of the chart block provides fast access to modifying the parameters presented in the platform section "Settings" -> "Interface" -> "Chart":

Users can access the context menu by right-clicking anywhere on the empty area of the chart. Available settings:
- Strategies: Allows to show/hide the indication of active strategies for the selected symbol in the top left corner of the chart, in the indicator area. More details can be found at the end of the article (point 11).
- Order lines: Enables or disables the visualization of interactive orders on the chart.
- Trade icons: Allows you to show/hide indicators of executed orders on the chart.
- Breakeven line: Lets you show/hide the breakeven line on the chart.
- The breakeven line contains all the buy and sell orders displayed on the chart. It calculates at which price the asset should be sold to breakeven. The line also considers the exchange's commission for executed trades.
- To identify breakeven point, it's necessary to scale the chart so that only the trades you want to calculate the breakeven for are visible within the TV chart window. This way, users can display the breakeven level for the last trade as well as for all trades.
Settings available only for futures trading symbols:
- Position breakeven line (P:BE): Allows to show/hide the breakeven line for the last opened position on the chart.
- The position breakeven line considers only the buy and sell orders displayed on the chart that were executed after opening the last position. Trades visible on the chart but executed before opening the last position are not in the calculation.
- Position entry price line (P:EP): Allows to show/hide a line on the price where the last position was opened.
- The position entry price line considers averaging, shifting based on the average entry price, but does not consider partial reductions of the position.
- Displays PNL for the size of the currently open position; in case of partial position reductions, the position entry price line displays PNL for the remaining margin.
- Position liquidation line (P:LQ): Allows to show/hide a line on the price where the exchange forcibly close the position based on the selected leverage.
10. Breakeven Line
The breakeven line indicator is available for both spot and futures symbols. The position breakeven line indicator (P:BE), position entry price line indicator (P:EP), and position liquidation line indicator (P:LQ) are available only for futures symbols.
11. Trading Instrument Indication

Displays brief information about active strategies for the selected symbol, both active and those in waiting mode.
If a drawing tool is attached to an active strategy, it is marked with a "lightning" icon (available only for Fibo and Intraday strategies).
Hovering the cursor over the strategy indicator opens a context menu, offering actions when clicking on the icons:

- "Eye Icon": Allows to hide/show the drawing tool attached to the strategy on the chart. It also allows to redraw the attached drawing tool on a clean chart if the user didn't save the chart template after creating the strategy.
- "Gear Icon": Opens the settings window for the selected strategy.
- "Cross Icon": Forcibly stops the strategy.
- "Ellipsis Icon": Upon clicking, opens a dropdown list with additional actions:
- "Copy Data": Copies strategy data to the clipboard.
- "Add Stop Loss": Quickly adds an additional Stop Loss for the strategy.
Was this article helpful?
That’s Great!
Thank you for your feedback
Sorry! We couldn't be helpful
Thank you for your feedback
Feedback sent
We appreciate your effort and will try to fix the article