Available for the following licenses:
New features are available to all users. However, certain analysis tools depend on your license level:
Base and higher: Provides access to order book delta, the liquidation timeline, and large trades in the tape.
Plus: Everything available in Base, plus order book imbalance (bid/ask ratio bar).
This block shows live exchange orders for the current pair. Colors are consistent throughout: bids (buys) are green, asks (sells) are red, and cancellations or neutral changes are gray.
With the latest update, the block gained a set of new layers and settings: real-time volume change, large-order highlighting, an on-level trading-activity indicator, your own position markers, and more. Below is a detailed description of every feature.
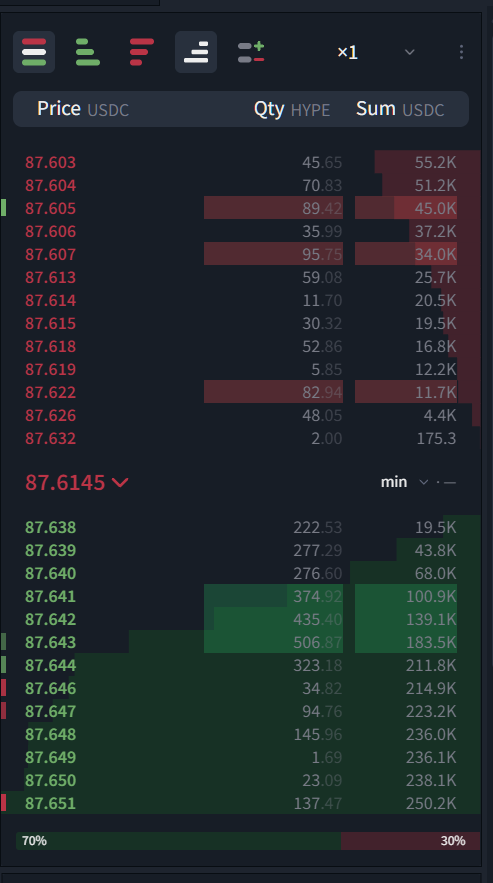 BTCUSDT order book with the Δ layer on — net level change over 30s to the left of quantity, volume bars on the right, bold rows are walls, colored strips on the left edge show who traded at the level, bid/ask share bar at the bottom
Block settings
The top-right corner of the block has a "⋮" button. It opens the "Block settings" window with three groups: "Layers", "Display", and "Data". An (i) icon next to more advanced options shows a short tooltip on hover.
Any layer can be turned off individually, and the "Reset to defaults" button at the bottom of the window restores every parameter to its initial state.
Note: settings are stored in the browser (localStorage), separately for the order book and for the trades feed. They don't sync across devices or browsers and aren't tied to your account. Clearing site data in the browser resets them to defaults.
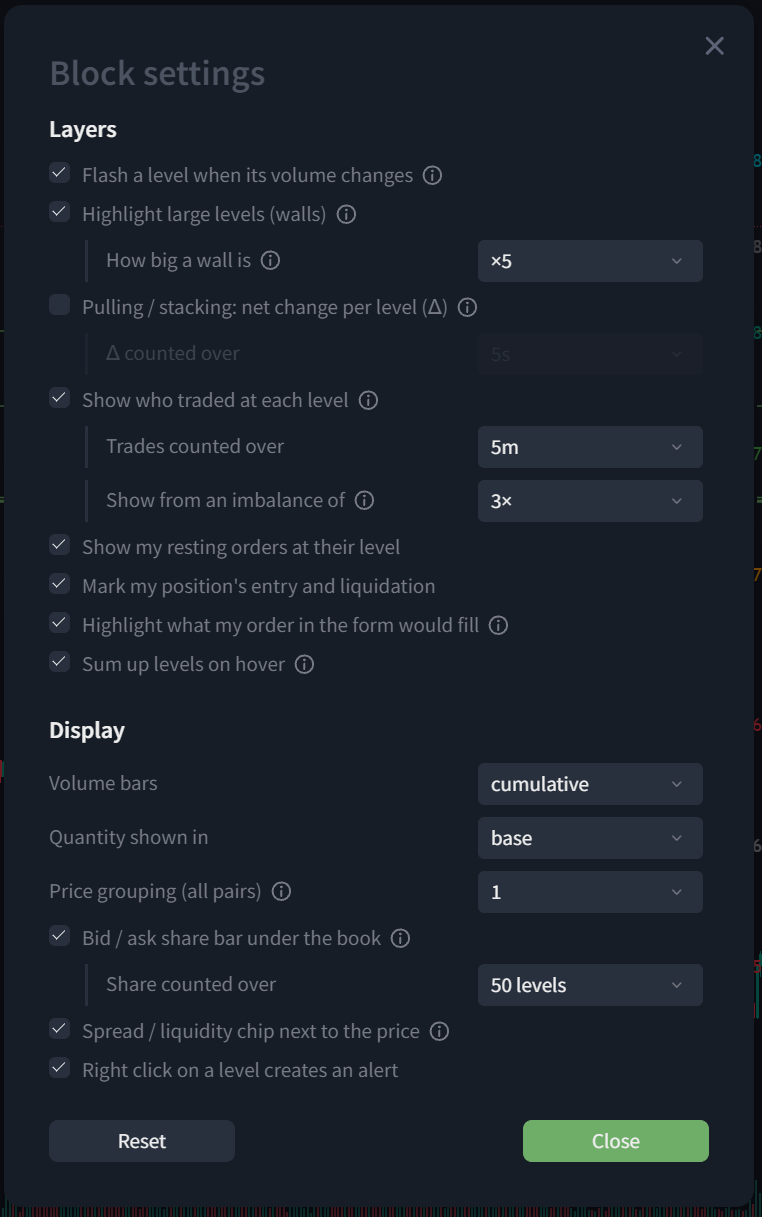 order book settings window — "Layers" and "Display" groups, indented child options, (i) tooltips, "Reset" and "Close" buttons at the bottom
Narrow mode
When the block's width drops to roughly 300px or less, some interface elements are automatically hidden or shortened so the layout doesn't break: the spread chip next to the price disappears, and column headers get shorter. The flow bar and the pressure bar stay visible regardless.
Quantity units
Clicking the "Qty" column header toggles the volume unit: the pair's base currency (e.g. BTC) or quote currency (USDT). The current unit is always shown next to the header.
In quote-currency mode, the size of expensive coins becomes instantly clear (330 USDT instead of 0.00412 BTC). The last column in this mode is called "Total" and shows accumulated value.
Block header
View: all / bids only / asks only
Three icons in the left part of the header switch the view: both sides, buys only, or sells only, using the full height of the block.
The bid/ask share bar under the order book is always calculated from the best levels on both sides, not just what's visible on screen — so it never shows 100/0 even in a one-sided view.
Σ — per-level or cumulative volume bars
The Σ button toggles how the horizontal bars behind each row are drawn: - Per level (default) — bar length equals the volume of that specific level. Shows where large orders sit. - Cumulative — the bar equals the sum of all levels from the best price down to the current one. The last column in this mode is called "Total" and answers the question "how much do I need to buy in total to reach this price".
This setting is duplicated in the "Display" group of the settings window.
Δ — pulling / stacking
The Δ button enables a layer showing the net volume change of each level over a chosen time window (5s, 15s, 30s, or 1 min — off by default, 5s window). A value like "+120" or "−340" appears to the left of the quantity: how much was added to or pulled from the level during that time.
- Green — orders are being added (stacking).
- Red — orders are being pulled (pulling).
Only noticeable changes are shown — at least 30% of what was on the level, and at least 5% of the largest level on that side. This lets you see where market makers are pulling liquidity ahead of a move, or, conversely, adding it.
Hovering over a row shows a tooltip with a breakdown: was / added / pulled / number of changes. The calculation window is changed in the block settings.
Price grouping: ×1 … ×1000
A dropdown on the right side of the header merges neighboring price levels into one. The step isn't set as an absolute number but as a tick multiplier of the current pair, on a 1-2-5 scale: ×1, ×2, ×5, ×10, ×20, ×50, ×100, ×500, ×1000. Next to each multiplier, in gray, is the actual price step for this pair (for example, on BTC ×50 is 0.5, while on a coin with a small tick, ×50 might be 0.000005).
The same multiplier choice works identically across all pairs: "×10" always means "ten ticks in one row", regardless of the coin's absolute price.
Worth knowing: - Asks group upward (toward the worse price), bids group downward, so the best price within a group never "improves". - The spread, the liquidity chip, and all markers are calculated from the ungrouped book — grouping doesn't affect them. - The number of decimal places in the price column depends on the selected step. - The grouping choice is saved and survives reconnects and pair switches.
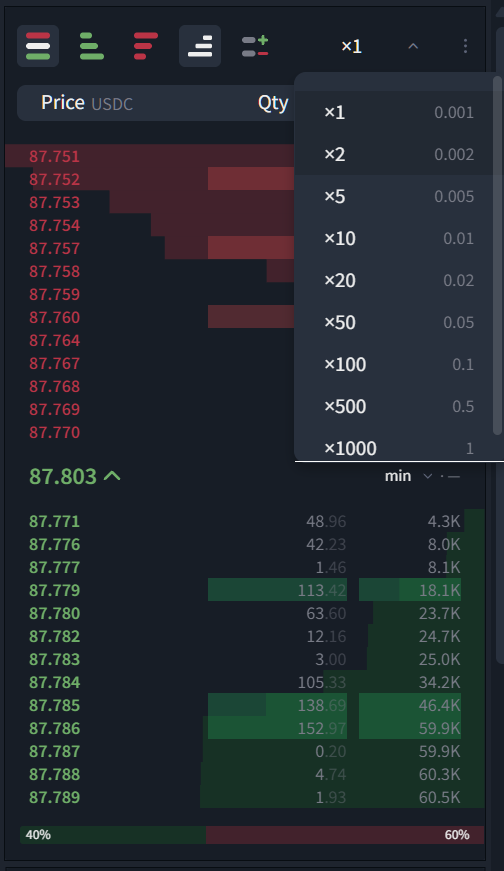 grouping dropdown — tick multiplier on the left, actual price step for the current pair in gray on the right
Price and spread in the center of the block
To the right of the last price sits a chip like "min ⌄ · 0.02%". On the left is a dropdown with the calculation mode; on the right, the value itself:
| Mode | What it shows |
|---|---|
| min | classic spread: best ask minus best bid, as a percentage of price |
| 100 / 1K / 10K / 100K / 1M (in quote currency) | "effective spread for volume" — the average price at which a market buy and a market sell of this amount would fill, and the difference between them. This is the real cost of entering and exiting with an order of that size |
| order | slippage for the order currently entered in the order form (side and size are taken from the form). If no size has been entered, the chip prompts you to enter one |
| ±0.1% / ±0.5% / ±1% | liquidity within a range — how much in bids and asks sits within this distance from the mid-price |
This is especially useful on a thin book: a "0.01%" spread tells you nothing about a 10,000 USDT order if it eats deep into the book. The "effective spread" mode shows the honest price of such an order.
Details: - A ">" prefix before the value means the book didn't have enough depth for the selected volume, and a lower bound is shown instead. - Hovering over the chip shows a tooltip with the absolute value and an explanation of the mode. - The selected mode is remembered in the browser. - The chip is hidden in narrow mode.
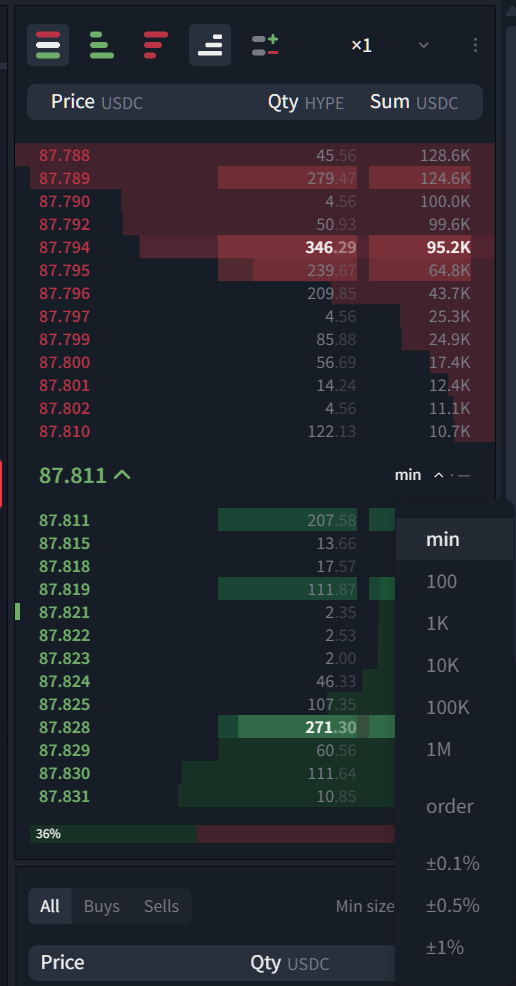 chip next to the last price with the mode list open — min, volumes 100…1M, "order", and ranges ±0.1…±1%
Level layers
Cumulative summary on hover
Hovering over a level highlights every row from the best price down to it, and a summary appears alongside: total quantity, total cost, average fill price, and slippage as a percentage of the current price — i.e. the answer to "what happens if I buy everything up to this level with a market order", without a calculator.
The summary above the asks is shown above the row; above the bids, below it, so it doesn't cover the center of the block where the price is.
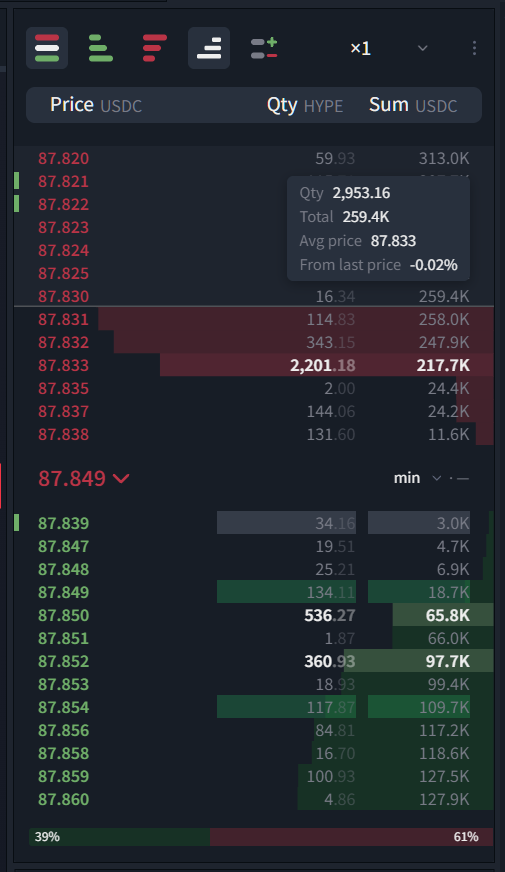 cursor on an ask eight levels from the best price — rows up to it are highlighted, the summary shows total quantity, cost, average price, and distance from the current price
Level-change highlight
A level whose volume noticeably grows or shrinks since the previous redraw flashes once: red for asks, green for bids, gray when volume is pulled. Only the quantity and total cells flash, not the whole row.
The change threshold is intentionally high (at least 30% of the level and at least 5% of the largest level on that side) so the indicator doesn't fire on every little tick on active pairs.
Walls
A level many times larger than its neighbors is shown in bold with a brighter bar. A level counts as a wall if its volume is at least 5, 10, or 20 medians of its side (configurable) and at least 20% of the total visible volume of that side. This makes large limit orders visible right away, even with volume bars turned off.
Who traded at the level
A thin colored strip on the left edge of a row shows levels where, over a chosen window (1, 5, or 15 minutes), market buys clearly outweighed sells (green) or the other way around (red) — not where orders are sitting, but where trades actually happened. The strip appears only if one side traded at least 2, 3, or 5 times more than the other (configurable) and the level accounted for at least 0.5% of the window's volume.
Hovering over the row shows a tooltip with the buy/sell breakdown and the imbalance ratio. This data comes from the terminal's shared trade log — the same one the "Trades feed" block uses, so it depends on the "Data" settings in the feed.
My orders at their level
Requires being signed in with a connected exchange.
If your own limit order sits at a level, its size is printed next to the total quantity: "Yours: 0.5 of 12.3 (4%)". This shows your place in the queue right in the order book, without checking the orders table. Only limit orders for the current pair are counted; with price grouping on, the order falls into whichever group its price belongs to.
Position entry and liquidation markers
Requires being signed in with a connected exchange. Works only on perpetual contracts with an open position on the current pair.
An orange "E" marker is placed at the average entry price of the open position, and a red "LIQ" marker at the liquidation price. This puts the position and its danger zone right in the order book, next to current orders. If the liquidation price is far outside the rendered rows, the marker simply doesn't fit on screen — that's expected.
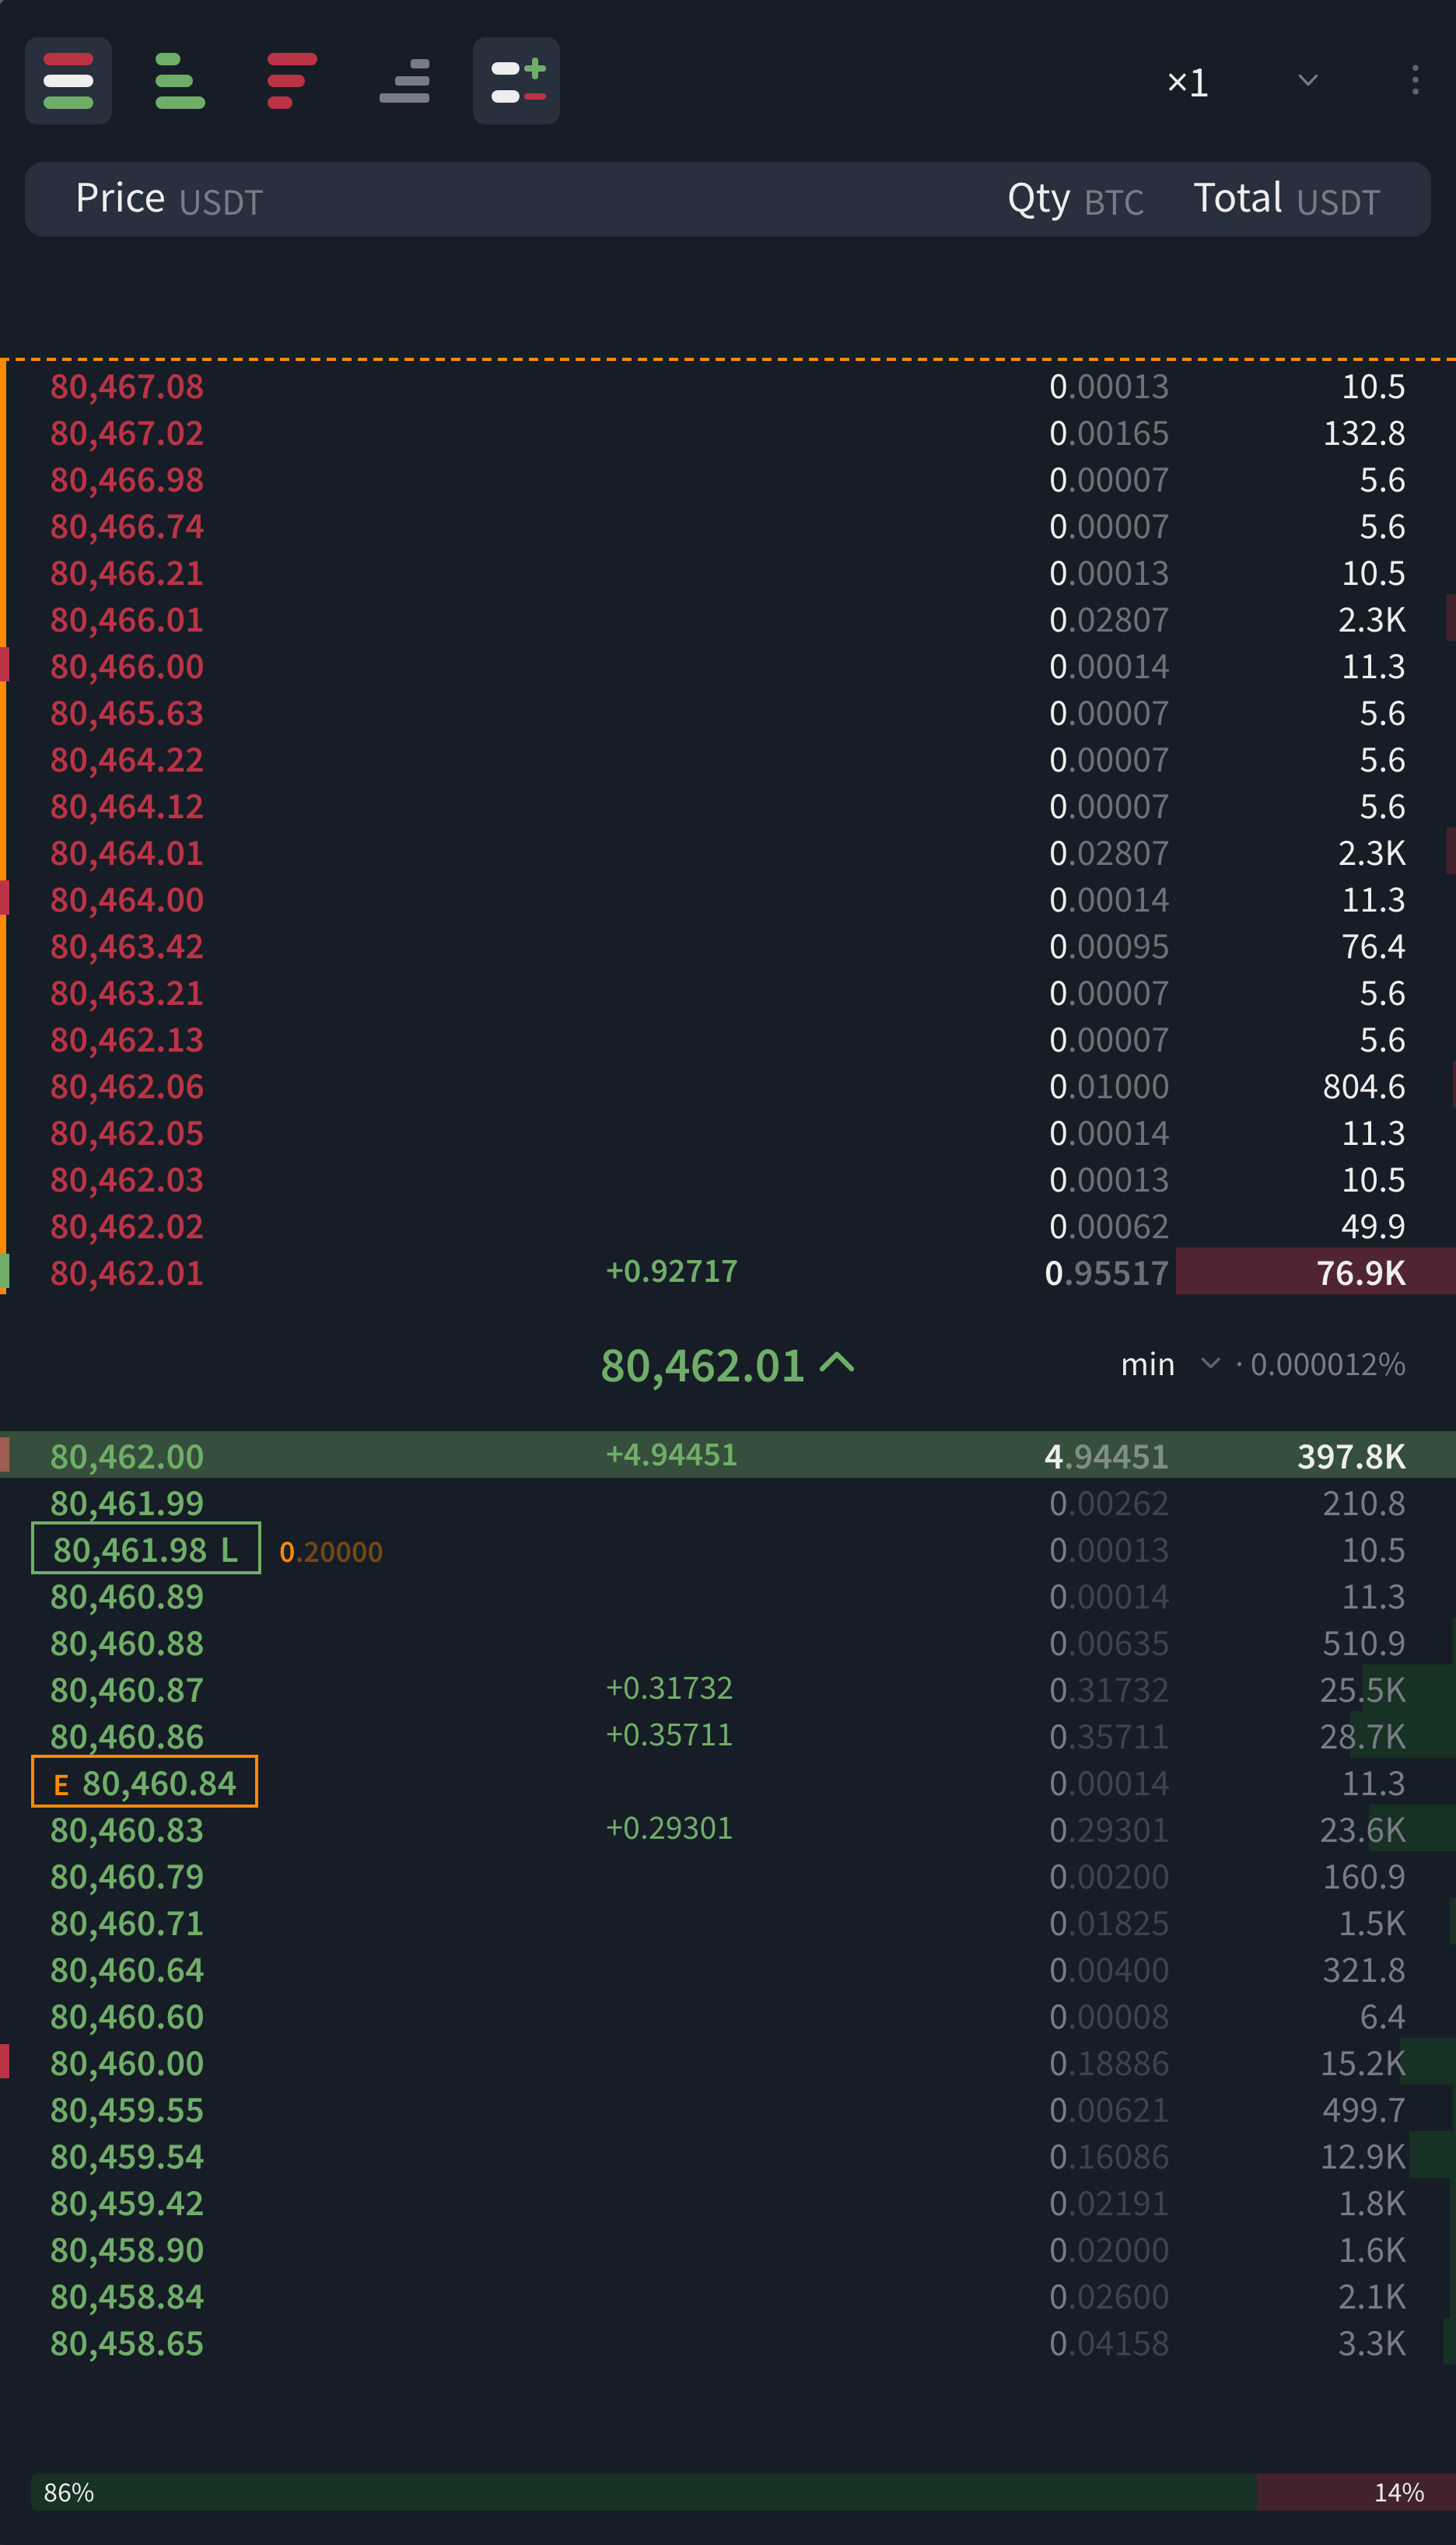 all markers in one shot — an "L" outline and an orange quantity value for your own limit order and its remaining size, "E" for position entry, "LIQ" for liquidation price
What your form order would eat
The order book is linked to the order form. While a size is being entered in the form, the levels a market order of that size and side would consume are marked on the left, and the last one gets a dashed line. Changing the side or size in the form recalculates the highlight instantly. Before you even click "Buy"/"Sell", you can see how far into the book the order would go — combined with the "order" mode in the spread chip, this gives a full picture of slippage.
User orders: letter markers
To quickly find your own orders in the book, a highlight appears next to the price:
- Letter L marks the user's limit orders.
- Pending Stop-Limit orders are marked with SL.
- For a TPSL order, only its Take-Profit part is shown in the order book — as TP: Limit, marked with L. The SL: Stop and Limit orders don't reserve funds before activation and aren't shown in the order book.
Mouse actions
| Action | What happens |
|---|---|
| Click on a level | fills the level's price into the order form and switches the side: clicking an ask preps a buy, clicking a bid preps a sell |
| Shift + click on a level | fills in the form's price and size: the accumulated quantity from the best price down to this level ("take everything up to here"); the form recalculates the total |
| Right-click on a level | creates a price alert at that price on the active chart (the same mechanism as the "+" button on the chart). Requires being signed in |
Below the order book
Bid/ask share bar
At the very bottom of the block is a horizontal bar: the green part is the bid share, the red part the ask share, of the volume across the best 10, 20, or 50 levels of each side (configurable). Percentages are labeled at the edges. This is the classic order book imbalance indicator — a quick answer to "who has more weight near the price right now".
The bar is calculated from the best levels, not from however many rows fit on screen, so it doesn't depend on the block's height or the selected view (all / bids / asks).
Behavior
Pair switching without a spinner. When switching pairs, the old rows stay on screen dimmed (clicks on them are disabled) until the new pair's snapshot arrives — usually about a second. The loading spinner only shows when there's no data at all.
Resilience to reconnects. If the connection drops and comes back, grouping, selected modes, and layers are preserved — the order book rebuilds with the same settings.
All order book settings
Layers
| Option | Values | Default | What it does |
|---|---|---|---|
| Highlight a level on volume change | on / off | on | One-time flash of the quantity cells on a noticeable change |
| Highlight large levels (walls) | on / off | on | Bold font and a brighter bar |
| ↳ How large is a wall | ×5 · ×10 · ×20 | ×10 | How many medians of the side the level must reach |
| Pulling / stacking (Δ) | on / off | off | Net level change next to the quantity; duplicated by the Δ button |
| ↳ Calculate Δ over | 5s · 15s · 30s · 1m | 5s | Calculation window |
| Show who traded at the level | on / off | on | Buy/sell imbalance strip on the left |
| ↳ Count trades over | 1m · 5m · 15m | 5m | Accumulation window |
| ↳ Show from imbalance of | 2× · 3× · 5× | 3× | Minimum ratio between sides |
| Show my orders at their level | on / off | on | Your own size next to the quantity (sign-in required) |
| Mark position entry and liquidation | on / off | on | E and LIQ markers (futures, sign-in required) |
| Highlight what my form order would eat | on / off | on | Level markers for the size in the order form |
| Summarize levels on hover | on / off | on | Summary: quantity / cost / average price / % from current |
Display
| Option | Values | Default | What it does |
|---|---|---|---|
| Volume bars | per level · cumulative | per level | Duplicated by the Σ button |
| Show quantity in | base · quote | base | Duplicated by clicking the Qty header |
| Price grouping (all pairs) | ×1 … ×1000 | ×1 | Tick multiplier on a 1-2-5 scale; duplicated by the header dropdown |
| Bid/ask share bar under the book | on / off | on | Book imbalance |
| ↳ Calculate share over | 10 · 20 · 50 levels | 20 | How many best levels of each side to include |
| Spread / liquidity chip next to the price | on / off | on | Modes: min / 100…1M / order / ±0.1…±1% |
| Right-click on a level creates an alert | on / off | on | Alert on the active chart (sign-in required) |
Glossary
- Tick — the minimum price step of a pair.
- Level — an order book row: a price and the total order volume at it.
- Grouping — merging several neighboring levels into one, in a step that's a multiple of the tick.
- Bid / ask — a buy order / a sell order. The best bid is the highest; the best ask is the lowest.
- Spread — the difference between the best ask and the best bid.
- Effective spread for volume — the average market-buy price for amount X minus the average market-sell price for the same amount.
- Slippage — how much worse the average fill price is than the best price.
- Wall — a level many times larger than its neighbors.
- Book imbalance — the bid share versus the ask share in the volume of the best levels.
- Quote / base currency — in the pair ONE/USDT, the base is ONE, the quote is USDT.
Was this article helpful?
That’s Great!
Thank you for your feedback
Sorry! We couldn't be helpful
Thank you for your feedback
Feedback sent
We appreciate your effort and will try to fix the article
Ready to try it live?
Everything in this guide works in the LEXX terminal — exchange API connections, trading strategies and automation.
Open the terminal About LEXX Platform